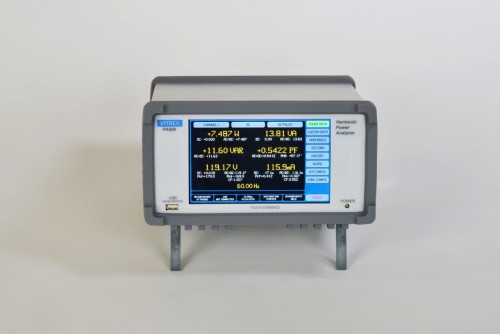
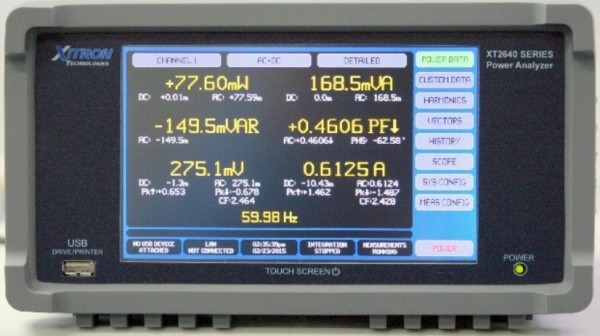
XT2640AD-4CH (4-channel Power Analyzer with 26A Element, 220-260kS/s, 24-bit Effective Resolution, Base Voltage Measurement Accuracy 0.025% x Displayed Reading (V))


Brand: Xitron
Model Series: XT2640 Series

About Product

The XiTRON XT2640 Series Power Analyzers are actually three power analyzers in a single chassis with a single user interface. These are called Virtual Power Analyzers (VPA) or Channels. The XT2640 Series may have up to 4 channels installed, which may be any combination of channel cards and with any combination of available current input options. Channels may be configured in any one (or none) of the 3 virtual power analyzers. Each virtual power analyzer may be configured for up to all channels installed. Each VPA is independently configured for multi-channel wiring configuration, signal filtering, default measurement coupling, display results smoothing and significant digits, VA/VAR combine method, and efficiency grouping. VPAs may optionally be configured to be synchronized to each other. The XT2640 Series boast an impressive array of precision power measurement capabilities, yet the color touchscreen user interface is refreshingly easy to use. Up to 500 harmonics at 400Hz meets Airbus avionics power measurement criteria and the Standby Power measurement meets full requirements of EN50564:2011. Various versatile interfaces including LAN, USB and RS232 and the XiTRON XView Software are provided as standard accessories. The XiTRON XT2640 Series Power Analyzers are the most advanced power measurement platform with an unprecedented range of capabilities.

Product Features

  • Screen display: 7” 800 x 480 pixel (approx. 0.0075” resolution) 18bpp color LCD with a high resolution pressure sensing touch panel
  • Reliable state of the art fully solid-state design with 2.9GIPs RISC processing and FPGA based sampling control
  • Highest precision measurements with industry-leading noise floor and linearity
  • Standby Power measurement meeting full requirements of EN50564:2011 is built into the XT2640 as standard. A computer is not needed
  • Modular design for up to four Power Measurement Channel Cards in any combination of four different Channel Card types
    • S: Provides 0.1% accuracy, 1MHz class bandwidth and 22-bit sampling
    • A: Provides world class 0.03% accuracy, 1MHz class bandwidth and 24-bit sampling
    • L: Same as the A type but optimized for lower voltage applications such as AC-DC and DC-DC power supplies
    • W: Provides 0.1% accuracy, 5MHz class bandwidth and 24-bit sampling
  • Each channel card type is available with one of three current input options in any combination in a single XT2640
    • D: Dual Shunt (up to 20Arms continuous and 150Apk inrush measurable, 250Apk withstand) in a single input terminal pair with resolution down to 0.1μA – no need to change terminals
    • H: High Current (up to 30Arms continuous and 200Apk inrush measurable, 300Apk withstand) with resolution down to 10μA
    • X: External Current Transducer or Shunt Input (up to 15Vrms) with resolution down to 0.1μV
  • A choice of screens to view the measurements, just one touch to change between any screens
    • Power Data Screen: Displays V, A, W, VA, VAR and PF data for any single channel or for a group of channels, or display loading (impedance, resistance and capacitance/inductance), or display power loss and efficiency
    • Custom Power Data Screen: Lets you choose the data you want displayed in the color, font size and location you want, along with text you define
    • Harmonic Bar Chart Screen: Displays harmonics with flexibly scaled bar charts and also a scrollable textual listing of both amplitude and phase results and harmonics can be checked against user supplied limits for each harmonic with individual harmonic and overall pass/fail indications
    • Spectrum Screen: Displays signal spectral content with a user cursor for obtaining numerical levels
    • Vector Screen: Displays fundamental voltage and current vectors with user defined coloring
    • History Screen: The unit automatically maintains a continuous historical recording of measurement data – no configuration needed. Any data from this record may be viewed with user defined scaling, offset and color
    • Scope View Screen: An extreme resolution digital scope to capture events such as inrush current without interfering with other measurements
    • Cycle View Screen: Displays a single cycle of the voltage and current periodic waveforms, jitter sampled over multiple cycles within each measurement period giving time resolution down to 2.6ns – no configuration needed
    • Standby Power Screen: Fully compliant to EN50564-2011 low power measurement requirements without the need of a computer
  • In XT2640-4CH, the harmonic and spectrum analysis of voltage, current and power on all four channels for frequencies up to 435kHz (with option 892-26xx OPT H500 and W-type channel card) or 115kHz (with option 892-26xx OPT H500 and S- or A-type channel card). Harmonic analysis of up to 500 harmonics (option 892-26xx OPT H500) or 100 harmonics in the standard XT2640
  • Up to three different Virtual Power Analyzers™ (VPAs) may be independently configured in the one unit for input/midpoint/output power and efficiency tests – there is no need to interconnect separate units in order to make synchronous or non-synchronous group power measurements
  • Extremely wide dynamic range allows signals with crest factors to over 30:1 to be measured with full accuracy without having to reconfigure and allows range-less operation (within each shunt) providing truly gapless measurements with varying signals
  • All configured measurements are always performed, no need to reconfigure for specific results
  • Up to 100 readings per second with no reduction in accuracy
  • Measurements in each VPA are fully configured in a single screen at the touch of the screen, no hunting around for the configuration setting you need. Each may be configured as Nx1ø (1 to 4ch), 2ø3w (2ch), 3ø3w (2ch), 3ø3w (3ch) or 3ø4w (3ch) and each VPA has totally independent measurement configuration
  • Front Panel USB Drive Interface for portable flash drives or hard disc drives:
    • Data log to a file and internal memory in CSV or binary formats at up to 100 per second
    • Export a tabulation of historically saved data – needs no prior knowledge of the data to be recorded
    • Save an image of the screen – great for engineering record keeping
    • Import and export configurations – great for sharing a configuration between units or just having your very own configuration handy
    • Import and export harmonics limits – makes it easy to switch between different harmonics requirements
    • Export CSV format textual tabulations of measurement results, harmonics, spectrum, or scope waveforms – makes generating your own reports easy without mistakes
  • Internal non-volatile memory of over 2Gbyte size
  • Safety: CE Mark certified to EN61010 with certified conformance to CAT I, II, III and IV mains applications
  • XiTRON XView Software is provided as standard
  • Connectivity: Ethernet, High Speed Serial and USB (client), and optional GPIB interfaces

Product Functions

  • Front panel results screens
    • POWER DATA Screen
      • This displays V, A, W, VA, VAR and PF data for any selected channel or the totals for any selected analyzer. Along with the primary selected data the user may select to display further details such as non-default coupled data and peak data. Screens are provided for displaying loading and integrated data results. POWER DATA Screen enables you to view numerical results for all voltage, current, and power (W, VA, VAR and PF) measurements in peak, RMS, fundamental only or rectified forms, inrush, resistive/inductive/capacitive loading, integrated and long-term average measurements such as Watt-Hours, efficiency and power loss (See photo section)
  • CUSTOM DATA Screen
    • The user may build a custom data screen showing any of the available results from any of the channels and/or analyzers using a spreadsheet type format (one heading cell, and a 4×14 array of cells). Each cell may be defined as showing a measurement result (with or without preceding text and with or without units shown), or showing text or blank and each cell may be set for a selection of font sizes and colors. The definition for this screen may be constructed on an external computer using a free application provided with theXT2640 Series and then downloaded directly into the XT2640 using an interface or imported from a drive connected to the front panel USB port of the XT2640 (in this later case the number of available custom screens is only limited by the drive) (See photo section)
  • HISTORY Screen
    • The XT2640 Series continuously maintain an historical record of most measurement results (all non-harmonic results and selected harmonic results). The recorded values for up to 4 of these can be graphically displayed using the HISTORY screen. The user selects the data record to show, whether to display the trend, trend and extents, or the extents of the data within each data record, and also set the scaling, centre offset and color of the plot for each trace. The user may display the historical data for the entire recorded period of time. In this case the plot automatically scales horizontally to provide the entire span of time (from 5 seconds to 400 days total span) and includes a cursor which may be moved throughout this period by the touch screen (the cursor is always at a fixed time, not a fixed position in the screen). The actual values at the cursor position are listed numerically. The user may also display the historical data for a ‘zoomed’ time interval. In this case the user may select to zoom to a period surrounding the cursor position on the full history screen and then zoom in/out to a span showing ¼, 1/16th or 1/64th of the total time of the present history record and may move the zoomed display left or right using the touch screen. The cursor is always in the center of the displayed timespan (See photo section)
  • SCOPE Screen
    • Cycle View represents a single cycle of the voltage and/or current periodic waveforms. The waveforms in photo section represent a full 10V square wave in blue and a 50:1 zoomed in view in red. Since the user sets amplitude and scaling – the result is an almost unlimited ability to amplitude zoom to expose fine detail. The sampling is forced to be asynchronous to higher order harmonics which leads to an effective sampling rate of 384MSPS (See photo section)
    • Scope View offers waveform acquisition and analysis similar to a digital scope. Up to six signals can be displayed, each havinguser selectable scaling, offset and color. Time-base, trigger and trigger position are all user selectable. However, with amplitude accuracies as high as 0.03% – you are unlikely to find any other scope with this high level of precision (See photo section)
  • HARMONICS Screen
    • This displays a bar chart showing all available harmonics for any selected signal(V or A) and also a listing of any 8 harmonics numerical amplitudes and phases (scrollable within the available harmonics). The bar chart may be configured to show linear,relative linear, logarithmic or relative logarithmic amplitudes. The user may also import (via an interface or from a drive via the front panel USB port) a set of V and/or A harmonic limits which may optionally be applied. If a set of limits is available and has been enabled for the selected signal, the bar chart displays a limit line and also displays any failing harmonics as a red color above the limit (See photo section)
    • The XT2640 Series have the ability to compare voltage and current harmonicsagainst limits set for each harmonic independently for voltage and current (See photo section)
  • VECTORS Screen
    • This displays a polar chart graphically showing the fundamental voltage and current vectors for a selected channel or analyzer. As applicable for an analyzer theinter-phase voltages and non-measured phase (e.g. neutral) vectors are also displayed.The user may individually enable/disable the display of each vector (up to 10 can be shown at any given time) and also set the color of the vector. Additionally, thenumerical amplitude and phase of each vector is shown as a list and (for 3ø4w configuration) the positive, negative and zero sequence amplitudes are listed (See photo section)
    • Fundamental Vector Analysis is achieved as the fundamental voltage and current vectors for each virtual power analyzer and for each channel canbe viewed graphically on the screen and the numerical values(amplitude and phase) of each vector are displayed and can be obtained via an interface. The following vectors are available (as applicable for the analyzer configuration), either measured or computed as applicable – Voltage for each phase/channel and between each phase, Current for each phase/channel and Current for Neutral. Additionally, the numerical positive, negative and zero sequence voltage and current amplitudes are available when configured for 3ø4w measurements
  • STBY POWER Screen
    • The STBY POWER Screen enables a user to configure, start/stopand view the results of low power measurements in accordance with full compliance to EN50564:2011 standard inboth numerical and graphicalformats. The STBY POWER screen can be selected for view from any of the Main Data Screens by pressing the STBY POWER button. The XT2640 Series have the ability to perform low power measurements independently in each VPA, so a single XT2640 can perform up to 3 independent low power measurements. You select which VPA is being configured, controlled and viewed by using the VPA button (the leftmost across the top of the screen). The XT2640 Series perform the low power measurement in accordance with EN50564:2011 paragraph. 5.3.2, which is therecommended method for all low power measurements (See photo section)
  • SPECTRUM Screen
    • This is only available if option H500 is installable and only if the XT2640 Series are configured for spectrum analysis by the MEAS MODE setting on the MEAS CONFIG screen. Normally the XT2640 Series are used for general power analysis and harmonic analysis purposes, but in some situations they are desirable to perform spectrum analysis on the signals instead of harmonic analysis. If option H500 is installed, then this is possible in the XT2640. An example of this is for measuring distortion in accordance with some avionics specifications which require a spectral analysis with the spectrum analysis being performed with 20Hz resolution for frequencies up to 150kHz (note that this maximum frequency requires W channel types as it is above the 115kHz upper limit for L, S or A channel types). The XT2640 Series can be configured to measure the spectrum of all signals at the same time to this requirement. As a note, SPECTRUM mode is a single VPA mode; only one VPA can be used in spectrum analysis mode. You do not have to be viewing the SPECTRUM screen for spectrum data to be measured. When configured for spectrum analysis, the XT2640 Series still perform normal power analysis (unchanged) and also harmonic analysis (but limited to the fundamental component). The XT2640 is a single measurement DFT based spectrum analyzer not a ‘scanning’ type spectrum analyzer. When operating in SPECTRUM mode, the HARMONICS screen button shown on the right side of most screens is replaced by a SPECTRUM button. Pressing this button enables the results of the spectrum analysis to be viewed on the SPECTRUM screen (See photo section)
  • Data logging
    • The XT2640 Series have the capability of data logging up to 16 user defined measurements (or sets of harmonics measurements) at a user defined interval to a file on the front panel USB drive. Each set of data recorded at each data log interval is called a data log record. Data logging is not synchronous to any measurement period, but logs the data at each respective time interval. It is guaranteed that within a single data log record that all data from the same VPA is from the same measurement period. The XT2640 Series use a large internal FIFO buffer to prevent inconsistencies in the write speed of the drive from disrupting data logging. If this buffer is overrun then data logging continues, but some data log records may be lost. This buffer also allows you to initiate data logging before inserting a drive into the front panel USB drive port of the XT2640, but once a drive has been inserted it must remain in place until data logging is stopped (See photo section)
  • XiTRON XView Software
    • While all XiTRON precision test equipment is designed to be used in a completely stand-alone manner, there are times when external tools can aid or enhance the operation of an instrument. The XiTRON XView software tools and drivers are designed to help easily configure an instrument from a single screen, or are used to view a complete set of measurements in a single screen. Other XView tools are designed for data collection where results can be recorded in an Excel-compatible file for post-processing, insertion into reports, or simply for archival purposes. The XiTRON XView Software comes as standard for XT2640 Series
  • Mechanical channel
    • Optionally CH4 can be a mechanical MT type channel. This provides analog (DC voltage) or digital speed, direction and torque inputs for the measurement of mechanical motor or generator data

Product Application

  • AC to DC Power Supplies (Single or multiple outputs)
  • DC to DC Power Supplies (Single or multiple outputs)
  • DC or fixed frequency AC supplied variable or fixed speed motor drives
  • Power transformers (Single or multi-phase)
  • Lighting ballasts (Most types)
  • Standby or backup power supplies (AC or DC)
  • Photovoltaic power generators (DC-in; DC- or AC-out)
  • Mechanical motor/generator applications

Standard Accessories

  1. LAN Interface
  2. USB Interface
  3. RS232 Interface
  4. CD for XiTRON XView Software and Operation Manual
  5. Calibration Certificate
  6. Power Cable

Product Options

  1. 822-26AD (Card): Power Analyzer A Element, 220-260kS/s, 24-bit Effective Resolution, Base Voltage Measurement Accuracy 025% x Displayed Reading (V)
  2. 822-26AX (Card): Power Analyzer A Element with Opt X, 24-bit Effective Resolution, Base Voltage Measurement Accuracy 025% x Displayed Reading (V)
  3. 822-26AH (Card): Power Analyzer A Element with Opt H, 24-bit Effective Resolution, Base Voltage Measurement Accuracy 025% x Displayed Reading (V)
  4. 822-26E (Card): Power Analyzer E Element, 220-260kS/s, 24-bit Effective Resolution, Base Voltage Measurement Accuracy05% x Displayed Reading (V)
  5. 822-26LX (Card): Power Analyzer L Element with Opt X, 24-bit Effective Resolution, Base Voltage Measurement Accuracy 025% x Displayed Reading (V)
  6. 822-26SD (Card): Power Analyzer S Element, 220-260kS/s, 22-bit Effective Resolution, Base Voltage Measurement Accuracy 1% x Displayed Reading (V)
  7. 822-26WD (Card): Power Analyzer W Element, 850-1100kS/s, 24-bit Effective Resolution, Base Voltage Measurement Accuracy 2% x Displayed Reading (V)
  8. 822-MT: Motor Assembly with Speed and Torque Measurement C  Requires 1 Available Slot
  9. 892-26xx GPIB: IEEE-488/GPIB Interface, Replacing USB and Ethernet Interfaces
  10. 892-26xx OPT D: Standard Current Option, 2 Ranges, Max 20Arms
  11. 892-26xx OPT X: External Current Option, 2 Ranges, Max Input 15Vrms
  12. 892-26xx OPT H: High Current Option, 1 Range, 35Arms Max
  13. 892-26xx OPT EN: Built-in EN61000 Compliance Firmware for All Channel Cards in a Unit
  14. 892-26xx OPT H500: Allows up to 500 Harmonics on All W Channel Cards in a Unit
  15. 892-26xx OPT MU: Multi Unit Option
  16. 892-HC-7: Hard Carrying Case
  17. 892-RM-7: 4U (7” Height) Rackmount Kit for 4-channel Units
  18. 892-280X Cable IEC: Connection Cable, 4ft, IEC 5-15
  19. LS-XT2640: Lead Set

Related Catalog

XT2640 Catalog

Our Company

Miko, established in 1980, is a leading instrumentation distributor in Hong Kong and China.

Over the years, we have been fully engaged in the sales and marketing of electronic T&M instruments in the territory. Our market sector coverage includes telecommunication, power, data communication, audio, broadcasting and education.